The journal
A complete trading journal, not a list of results
A professional trade journal records the decision, not only the outcome. Trakfinity keeps the full context of every trade in one record, then turns that history into trading statistics you can act on.
Every trade keeps its full story, then becomes statistics you can act on.
What you record per trade
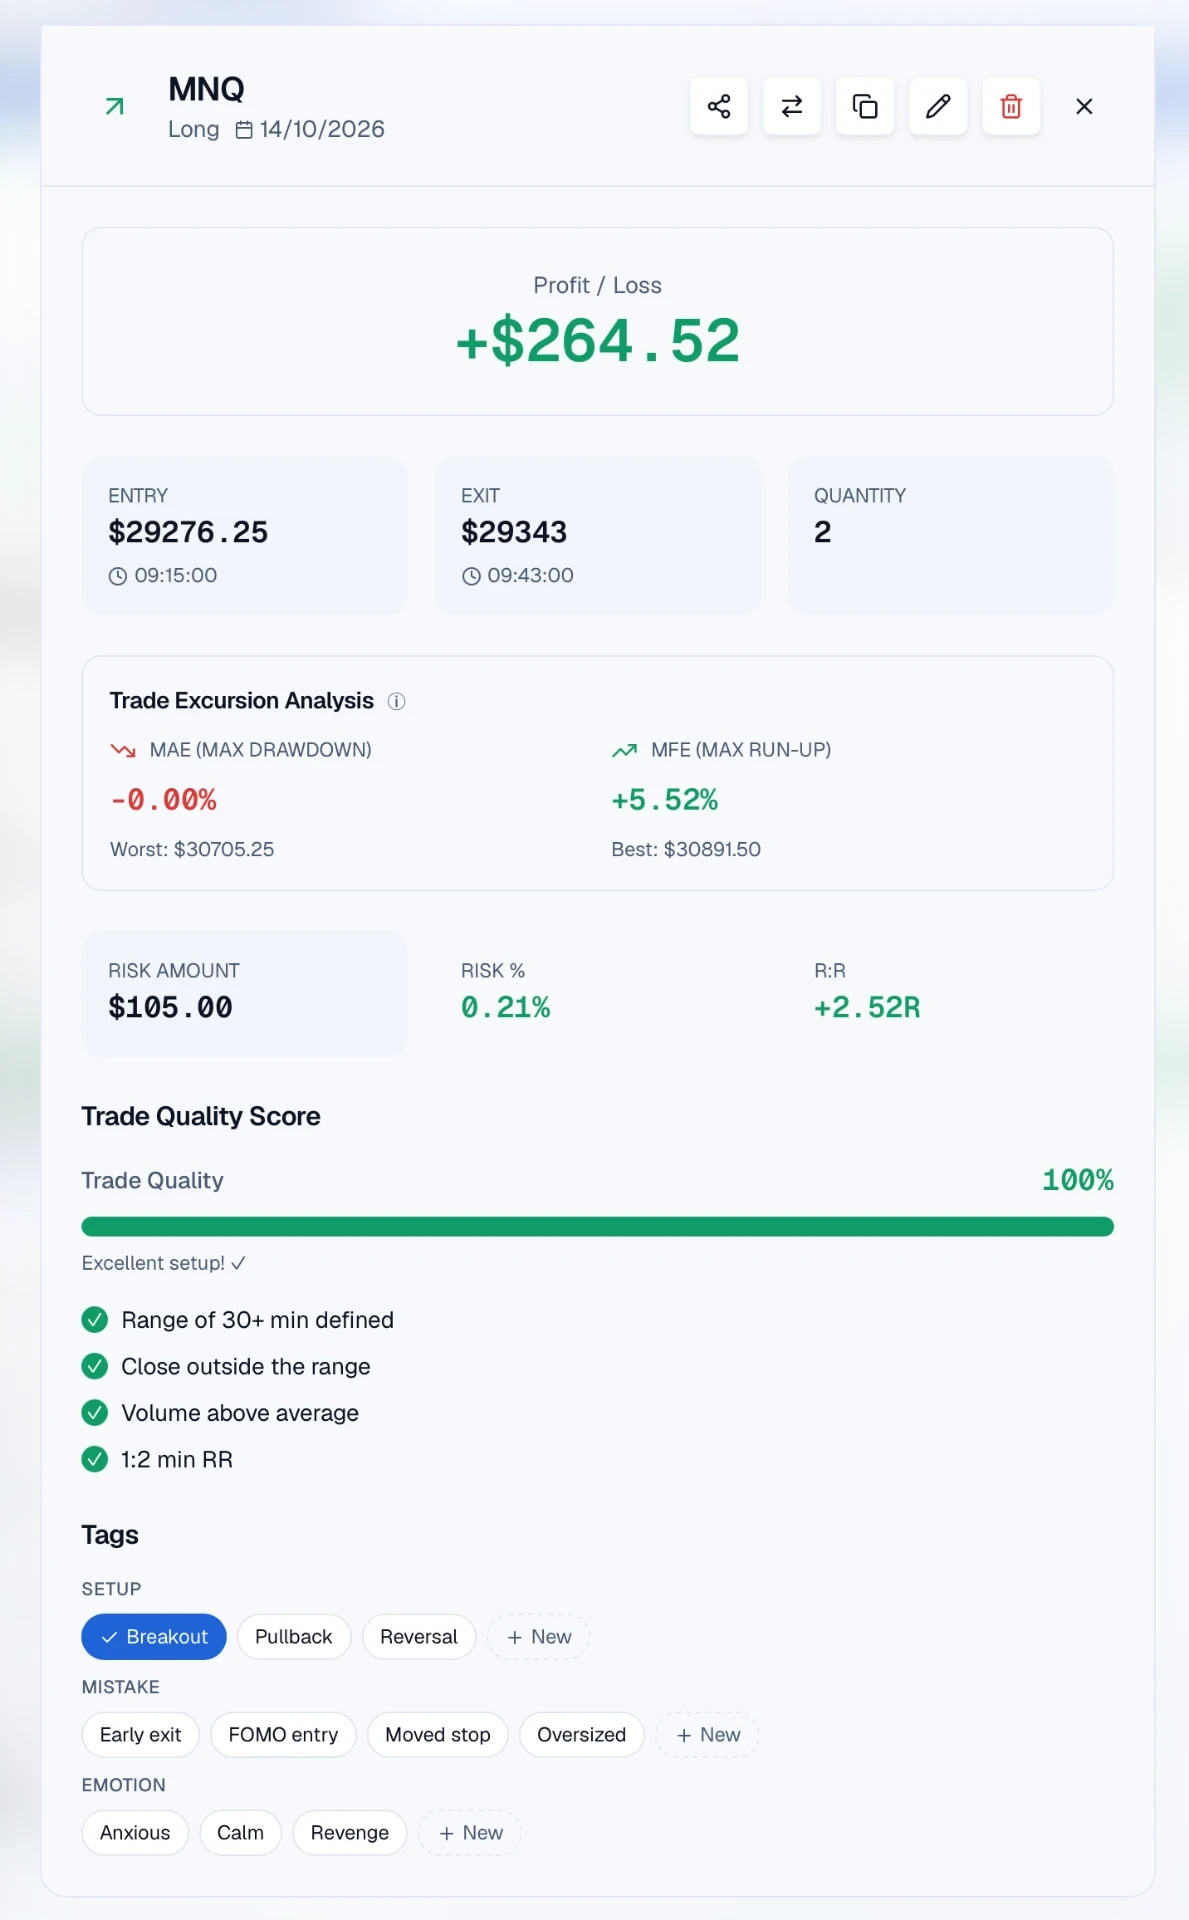
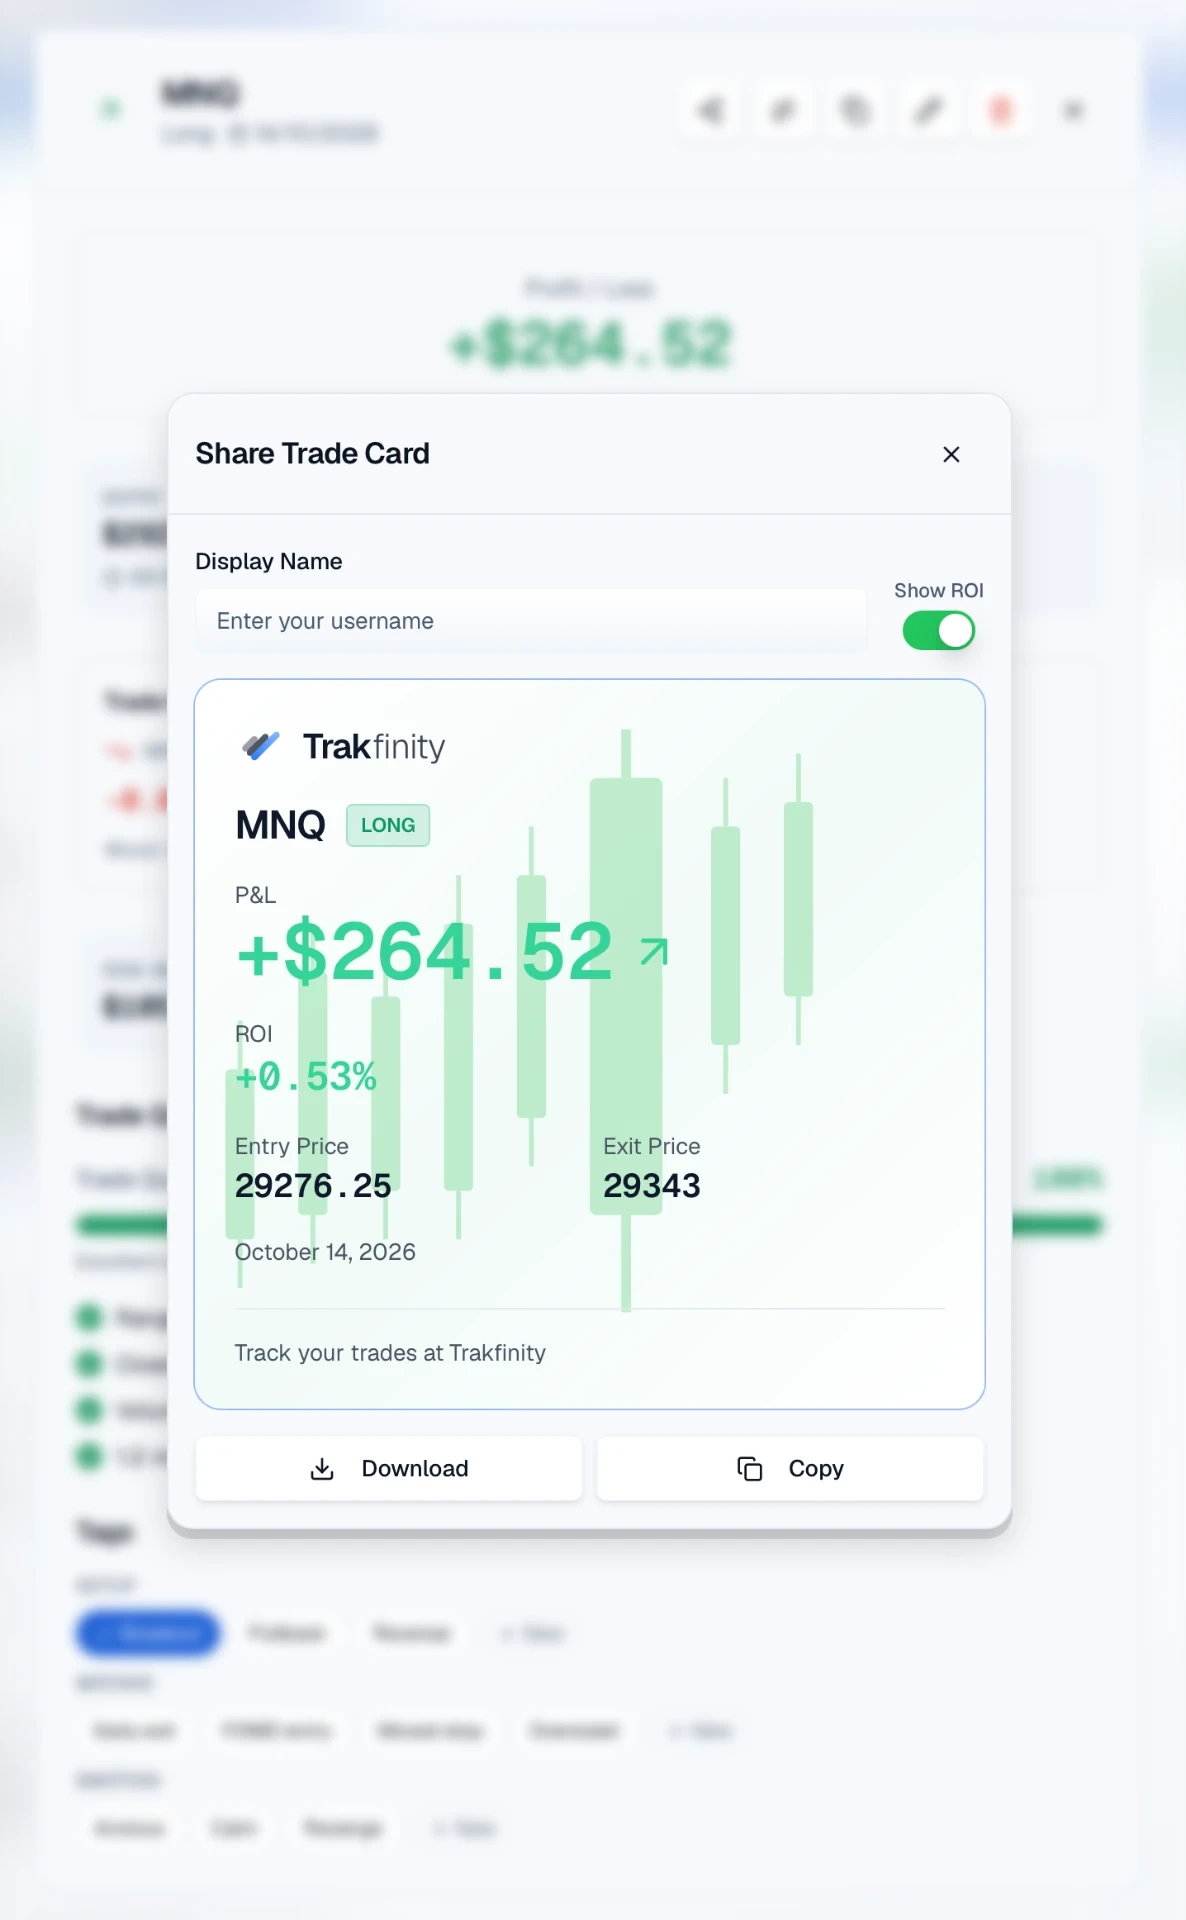
Each entry in your trading log captures the numbers and the reasoning behind them, so a review months later still makes sense.
- Entry and exit price, date and time
- Direction, position size and contract multiplier
- Stop loss, take profit and risk per trade
- Risk-to-reward ratio and realised R multiple
- Market, symbol, timeframe and session
- Strategy, setup and trade reasoning
- Commissions and fees in net P&L
- Chart screenshots before and after
- Written notes and emotional state
- Pre-trade checklist results and score
What Trakfinity measures
Your trade data is calculated for you — trading performance analysis, risk metrics and behavioural patterns update as soon as a trade is logged.
- Net profit and loss after costs
- Win rate, average win and average loss
- Profit factor and expectancy
- Equity curve, drawdown depth and recovery
- Average risk and risk distribution
- Performance by session, symbol and setup
- Day-by-day results on the trading calendar
- Discipline score graded A+ to F
- Consistency and overtrading heatmap
- Capital progress against your profit target
Risk management and position sizing
Risk per trade is calculated from your stop loss, position size and account capital, so you can see the real exposure behind each idea rather than estimating it. Average risk, risk-to-reward distribution and outlier flags show when sizing drifts away from your plan, and drawdown tracking makes both daily and maximum drawdown visible while it is still recoverable. For funded and evaluation accounts, that risk view sits next to the account rules you are trading under.
Trading psychology and discipline
Revenge trading, overtrading, FOMO entries and hesitation are habits, and habits show up in data. Tag the emotional state behind a trade, complete a pre-trade checklist, and Trakfinity checks your own trading rules every trading day. Both feed your 0–100 discipline score, graded A+ to F.